AI Solutions / Smart Business Dashboards
04 · Analytics

Deep business insights. No BI subscription.

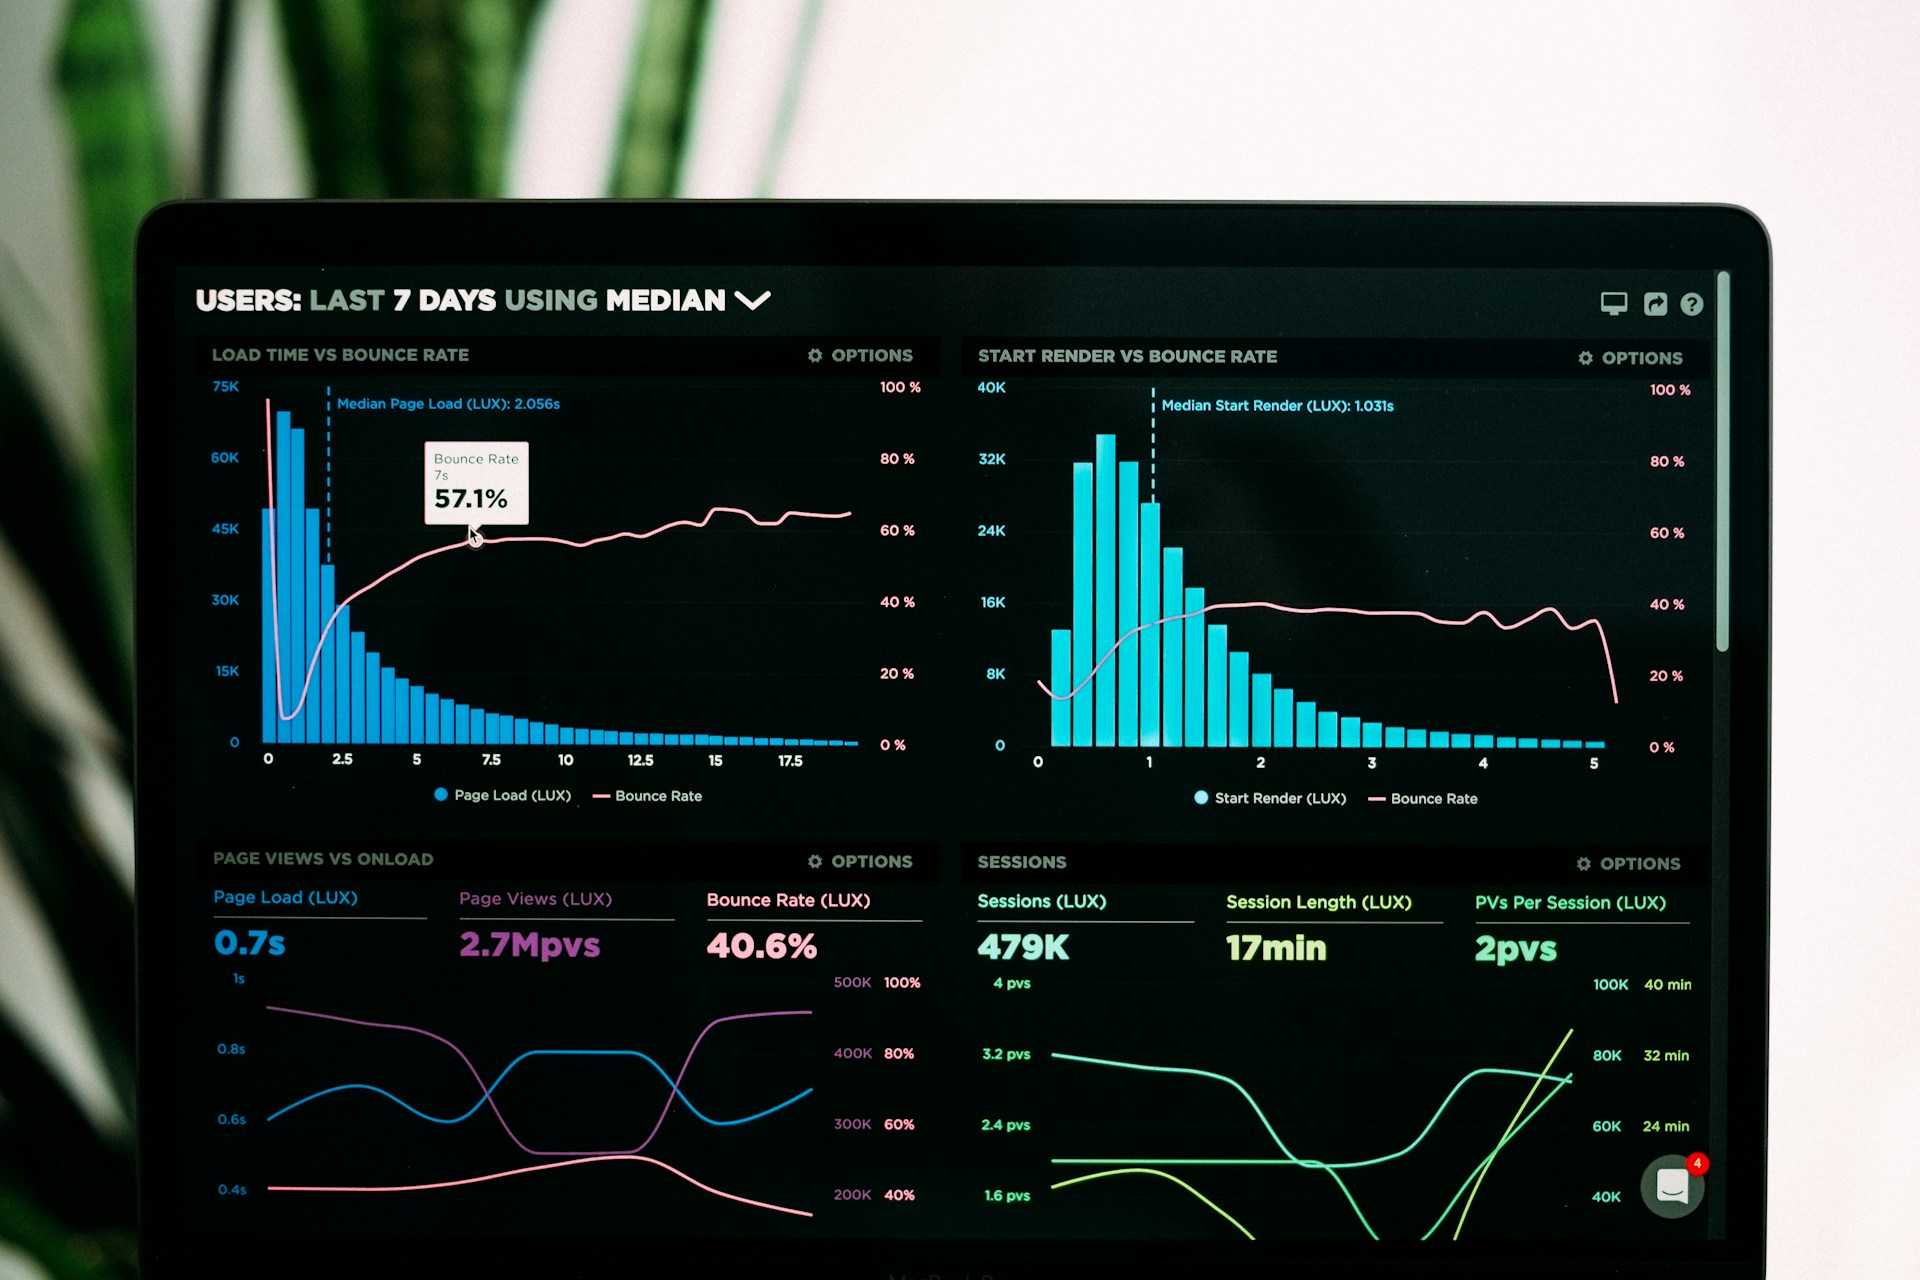
Realtime dashboards connected directly to your database. Interactive drill-down. Fully custom to your KPIs. Self-hosted, no Tableau or PowerBI licensing fees, no third-party data sharing.

flag

The Challenge

  • Enterprise BI tools carry per-seat fees that scale badly.
  • Data locked in databases, inaccessible to decision-makers without an analyst.
  • Static reports can't answer the follow-up question the CEO always asks.
construction

Our Solution

  • Realtime dashboards connected directly to your existing database.
  • Interactive drill-down — filter, pivot, and explore on the fly.
  • Fully custom to your business metrics and KPIs, not a template.
  • Self-hosted on your infrastructure — no third-party data sharing.
  • Optional AI layer for natural-language questions against your data.
trending_up

Value Delivered

  • Business insights on demand, no analyst required.
  • Meaningful cost savings versus BI tool subscriptions at scale.
  • Full ownership and privacy of your business data.
Stack

Production-grade infrastructure.

We pick the best-fit components based on your data volume, latency needs, and privacy requirements.

React · Next.js D3.js · Recharts Node.js · FastAPI PostgreSQL · BigQuery ClickHouse · DuckDB Docker · Self-hosted
Frequently Asked

Questions buyers ask before they sign.

What databases do you connect to?

Any SQL database (PostgreSQL, MySQL, SQL Server, BigQuery, Snowflake, ClickHouse), plus NoSQL (MongoDB, DynamoDB) and warehouses. We also support connecting multiple sources into a single unified view.

Can we get custom charts, or is it templated?

Fully custom. We start from your KPI list, not from a template. If you can describe the chart, we can build it. Common patterns (revenue over time, cohort retention, funnel analysis) are already in our component library and reused.

How does this compare to Tableau or PowerBI cost?

You pay a one-time build cost plus ongoing hosting (typically $50-200/month on your cloud). BI tools bill per seat or per capacity unit — the math flips in your favor after ~15 users or moderate data volume.

Can we control who sees what?

Yes. Role-based access control on views, filters, and even individual metrics. Common patterns: exec dashboard, ops dashboard, per-team dashboards, per-customer dashboards for external sharing.

Do you offer natural-language querying?

Optional. We can add an LLM layer where users type 'show me revenue by region for Q3' and the system generates the SQL and renders the chart. Requires a bit more discovery and validation during scoping.
Related Capabilities

More AI we ship.

show_chart

Customer Churn Prediction

Predictive layer on top of the same underlying data.

Explore →
settings_suggest

Business Automation

Trigger workflows off dashboard alerts.

Explore →
dns

On-Premise AI Serving

Add natural-language query without sending data to external APIs.

Explore →
Start a Project

Which question do you keep asking your data team?

Tell us the KPI you can never get a straight answer on, and we'll show you what a live dashboard for it looks like — before you sign anything.